
Massive traffic is not generated by guessing, publishing randomly, or copying trends. It is generated by observing user behavior, correcting execution errors, and repeating what works—systematically. Google Analytics is one of the most powerful operational assets available to businesses, yet it is widely misunderstood and underused.
Under Pillar 3: Systems for Execution & Business Operations, this article titled get massive traffic positions Google Analytics as a traffic execution and optimization engine, not a statistics platform. Its real value is not the data it collects, but the discipline with which that data is reviewed, interpreted, and acted upon.
Get massive traffic explains how businesses can use Google Analytics to:
- Identify which traffic sources actually produce results
- Understand how users move through the website
- Detect friction points that suppress growth
- Build repeatable optimization routines that increase traffic over time
Traffic does not scale through intuition. It scales through feedback-driven execution.
Tracking User Behavior
Google Analytics allows you to peek into how users behave on your website. This information is vital for making smart decisions about your site design and content.
Home Page Overview
Users and Sessions
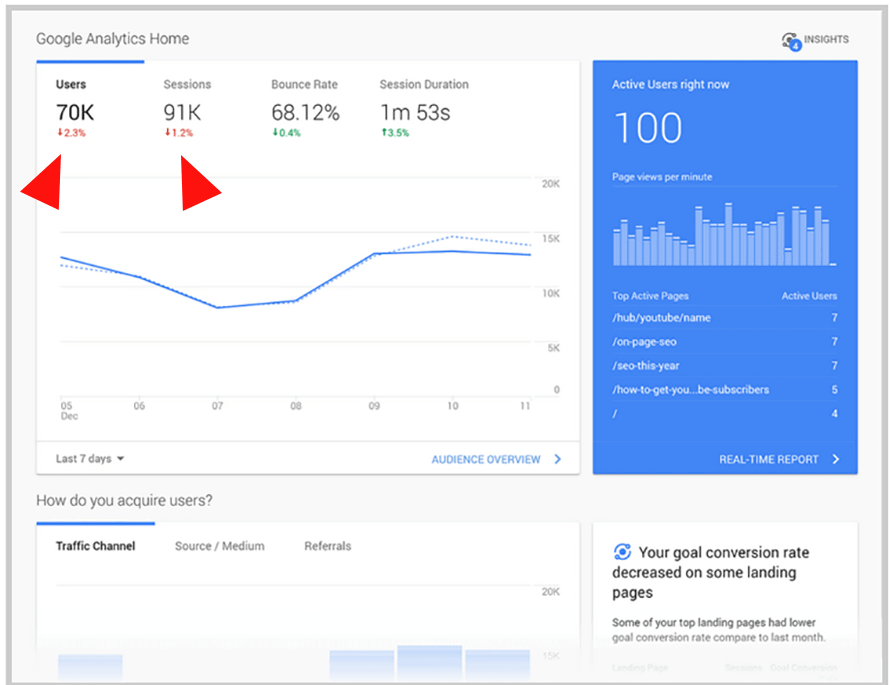
These numbers under users and sessions above represent how many people visit your website and how often they come back.
To emphasis this point further the Users are people visiting your website while the sessions figures above represent the amount of session the users have created as result of their visit to your site.
Bounce Rate
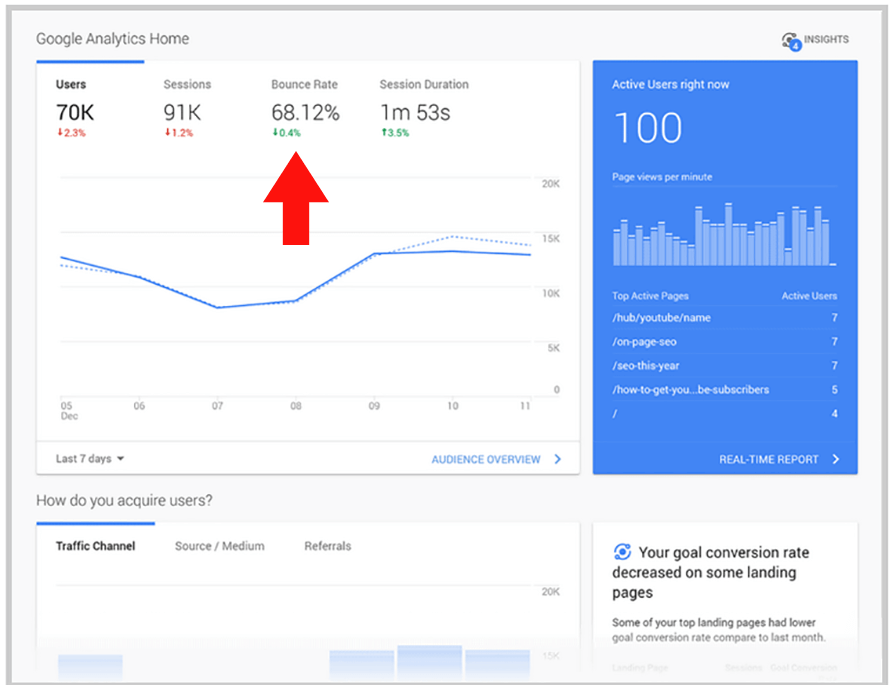
Bounce rate like you can see from the arrow above are percentage of people leaving your website without clicking around. This figure above is a collective bounce rate for all pages in your website. If you want to drill it down it is advisable to look at the bounce rate at the individual page level. This will give you more insight into how well each of your pages are doing.
Visit Amazon.com to Buy This Game. Your Family Deserve The Best:

Trekking The National Parks – The Award-Winning Strategy Board Game for Family
Session Duration
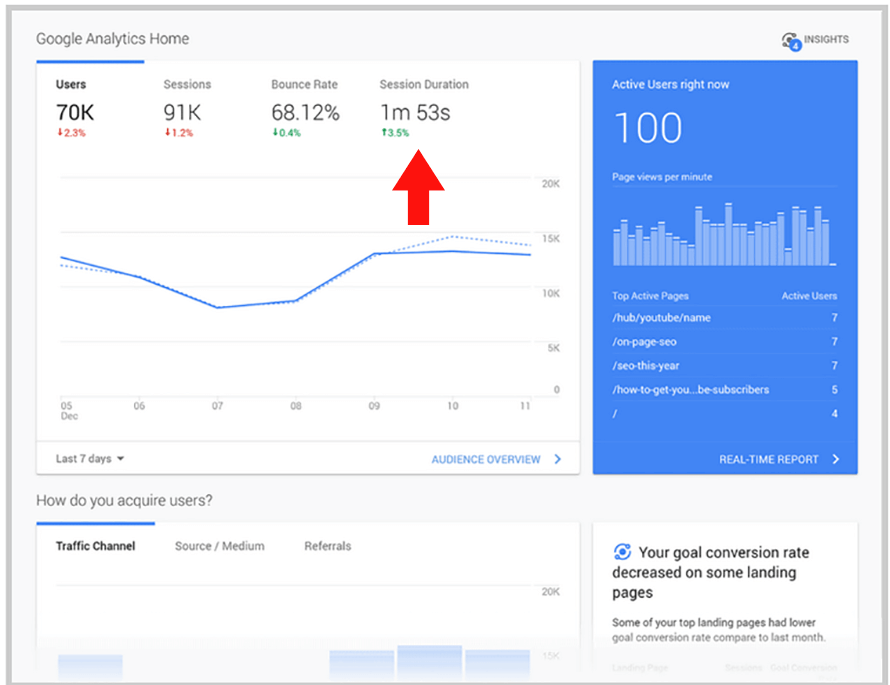
Session duration tells you how long people stay on your site. Again this figure above with arrow point is the average figure for all pages in your website. I will strongly advice to look at these measure page to enable make precise decisions regarding individual pages in your website.
Reminder: looking at bounce rates and session duration for each specific page is often more useful.
In this session on understanding user behavior to Get massive traffic to your websites using Google Analytics, we will dive into specifics like what pages users visit and the top devices used to view your sites.
What The Top Devices That Are Used To View Your Site
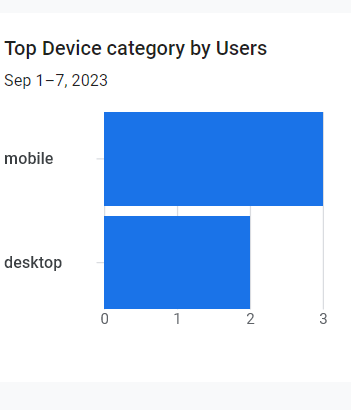
By analyzing the devices, you can gain insights into how individuals access and interact with your website. In other word the site owner needs to make sure of the design of his website and the content of the site that are viewed seamlessly on various devices ranging from desktop, tablet and mobile.
If your mobile percentage of your site visitor is very high make sure everything you do when you design your website is that you design mobile first because that is what majority of people are going to be looking at. A lot of people make the mistake of designing their websites without putting responsive design into consideration.
If mobile traffic is dominant, adopting a “mobile-first” approach may be recommended to ensure optimal user experience.( see the figure above is a brand new site am building. We will use this site for reference in future post).
Another point to consider is how the type of device impacts metrics like bounce rates and session duration. For example, high bounce rates on specific devices might indicate issues with compatibility or content relevance.
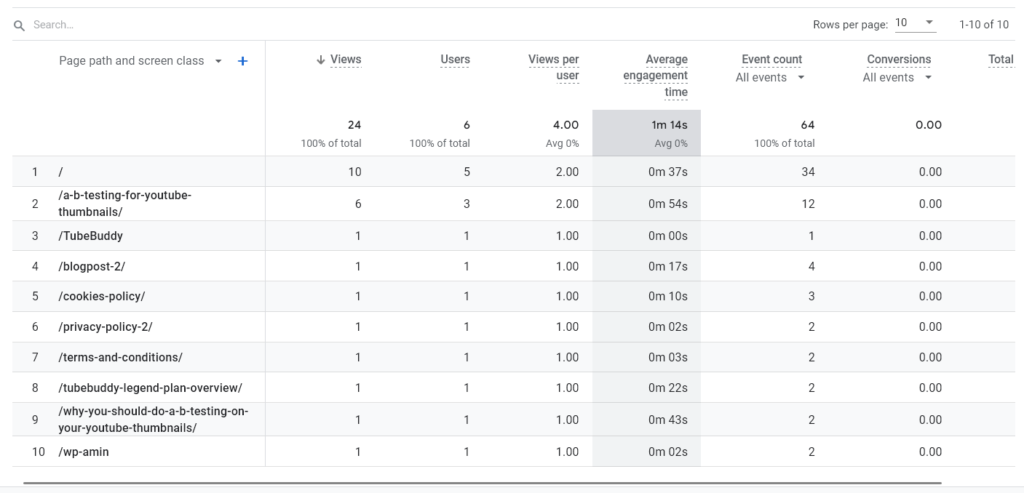
Get Massive Traffic By Knowing What Page/s Users Visit Most?
The last part of this crucial study on user behavior and get massive traffic using Google Analytics, will focus on pages users visit on a website. Understanding which page attract the most attention and engagement is very important for to you in making relevant decisions that will encourage more users to visit your site and grow your traffic and get you more conversions.
Table below highlights how you can visually identify pages that are doing well in terms of visits. If you apply the indices of measurement like bounce rate, session duration, users and session, most used devices you will get massive traffic to your site or shop online.
Google Analytics delivers its full value when integrated with other Pillar 3 execution systems, including content production workflows, SEO execution routines, and conversion optimization processes.
👉 Explore more articles under Pillar 3: Systems for Execution & Business Operations
Get Massive Traffic Through Page Popularity
With this insight you can identify the most popular page in your website. These are the pages that receive the highest number of visits from users. Such insights reveal which content or sections of the website are particularly appealing or valuable to visitors.
Using Google Analytics to improve your website is like understanding what people like and how they use your site. It’s like checking which gadgets they use in viewing your site, such as phones or computers, and making sure your site looks good on those gadgets.
You also need to know which pages on your site are popular and why ?
If lots of people find your site through Google, that’s good. But if people leave your site quickly, it might mean something needs fixing.
Sustained traffic growth is achieved through repeatable systems, not one-time optimizations. Within Pillar 3, this article reinforces that Google Analytics becomes a growth engine only when embedded into a structured execution system—where insights guide actions, actions improve performance, and results are continuously measured and refined.
Analytics tools provide insight, but insight alone does not create growth. Pillar 2 introduces intelligent digital tools; Pillar 3 ensures those tools are embedded into disciplined, repeatable execution systems.
👉 Return to Pillar 2: Intelligent Application of AI & Digital Tools
→ Apply Google Analytics as a traffic execution system
Traffic explodes when behavior is understood and execution is corrected. Google Analytics reveals the pattern—systems turn patterns into growth.
Measure consistently. Execute relentlessly. Traffic compounds.